Twitch Life
Manage Employee Wellness Program

The Challenge

Twitch is the world’s leading video platform and community for gamers. Twitch offers top-of-the-line perks to its employees. At the center of its benefits lies the Twitch Life program, which includes various employee wellness initiatives.

Twitch provided more than 50 wellness initiatives for over 1,300 employees worldwide, but needed a better way to track its initiatives than using Excel spreadsheets.

I worked with the HR team to design a dashboard that achieved the goal.

Role

Product designer worked alongside with stakeholders and engineers

Time

2018

Digging deep into research


The primary goal of the dashboard was to help the team make the best sense of the data, analyze trends, and drive decision making.

In order to design a customized dashboard for Twitch’s specific needs, I ran numerous interviews with the HR team to understand their needs.

Defining the problem


Following the interviews, I created an empathy map to synthesize the interview feedback, which helped uncover new insights and identify implicit user needs.

Next, I created a persona for the benefit manager to help me design a dashboard that will address their needs.

From the analysis, I learned that the HR team wanted a dashboard to:

  • Understand how employees are engaging with different initiatives as well as identify areas that need improvement.
  • Monitor the spending trends of different programs (e.g on-site programs, marketplace, and reimbursement) and wellness categories (e.g. fitness, mental, sleep, nutrition, etc).
  • Make data-driven decisions on how to optimize their budget allocation and where to invest in the future.
  • Ideate


    To design a dashboard that displays relevant, actionable data and track stats and key performance indicators (KPIs), I worked with the team to define metrics they would like to see and then created an information architecture to help me structure the data on the dashboard.

    Then, I determined the best visualization for each metric.

    Design


    I explored a variety of dashboard layouts. After discussing with the team, we've decided to move forward with the design that communicates the data most effectively. Next, I worked with color palettes and line weights to make the visualization look like Twitch and be harmonious.

    High fidelity wireframes

    Test and iterate


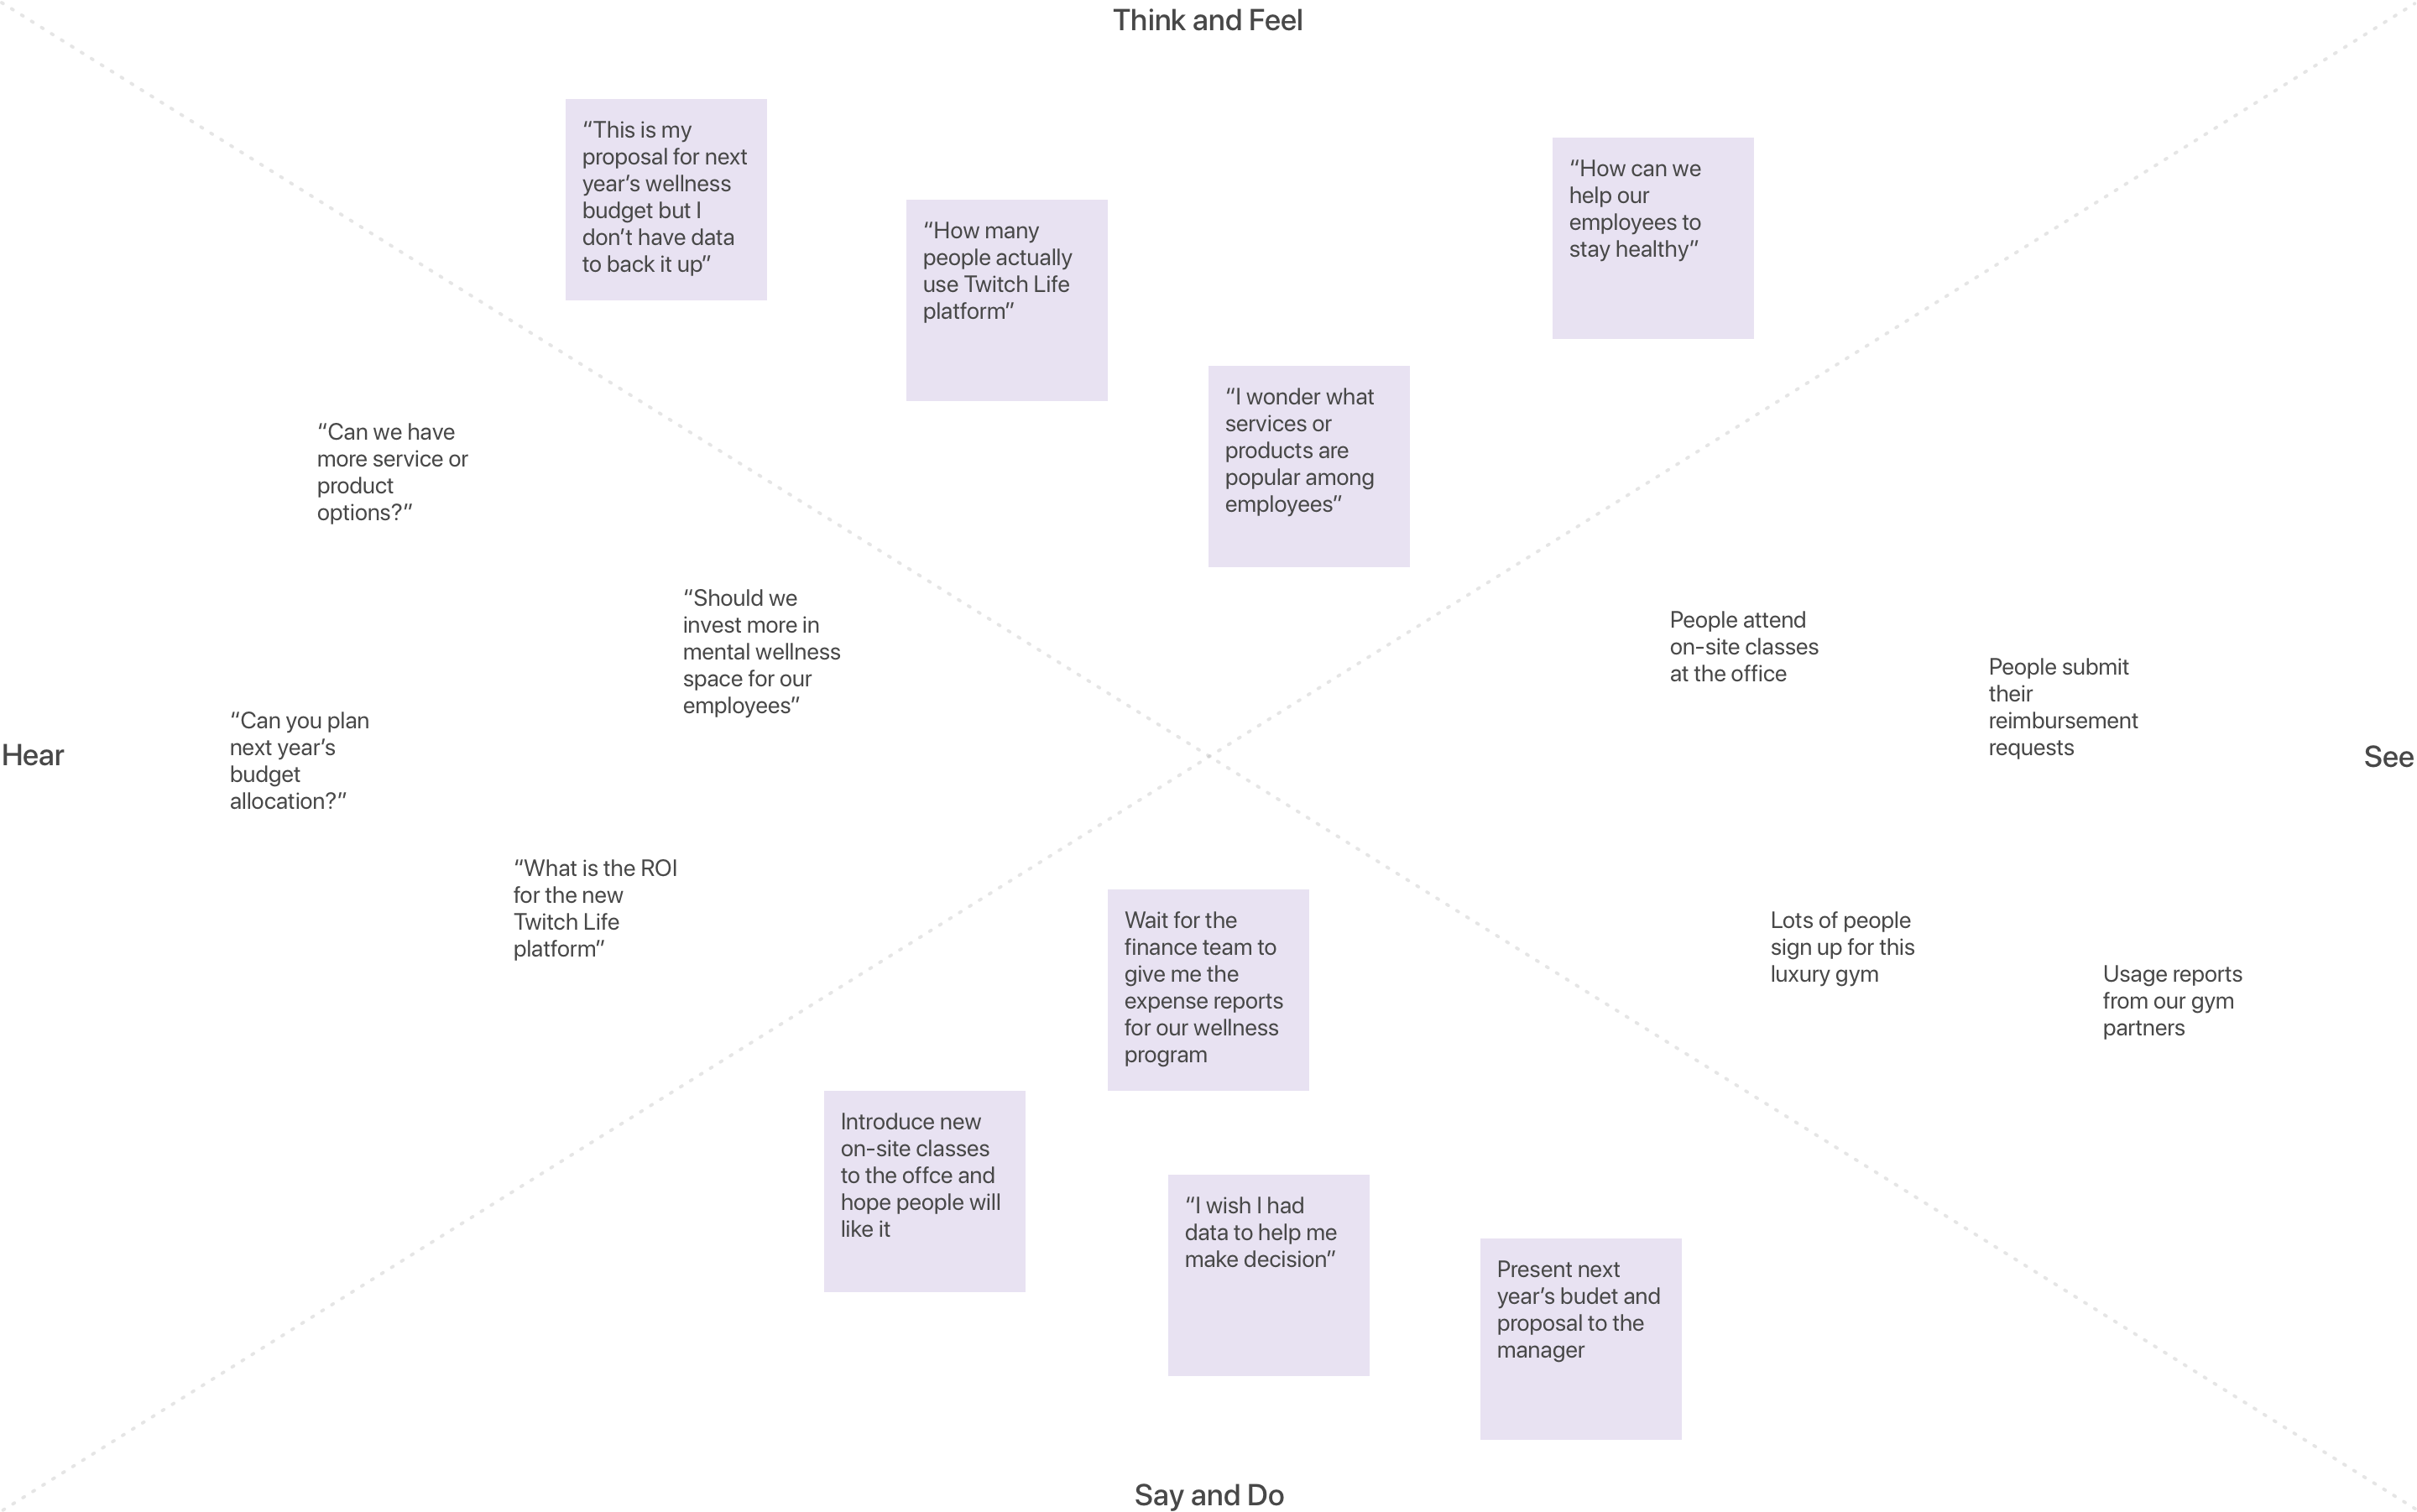
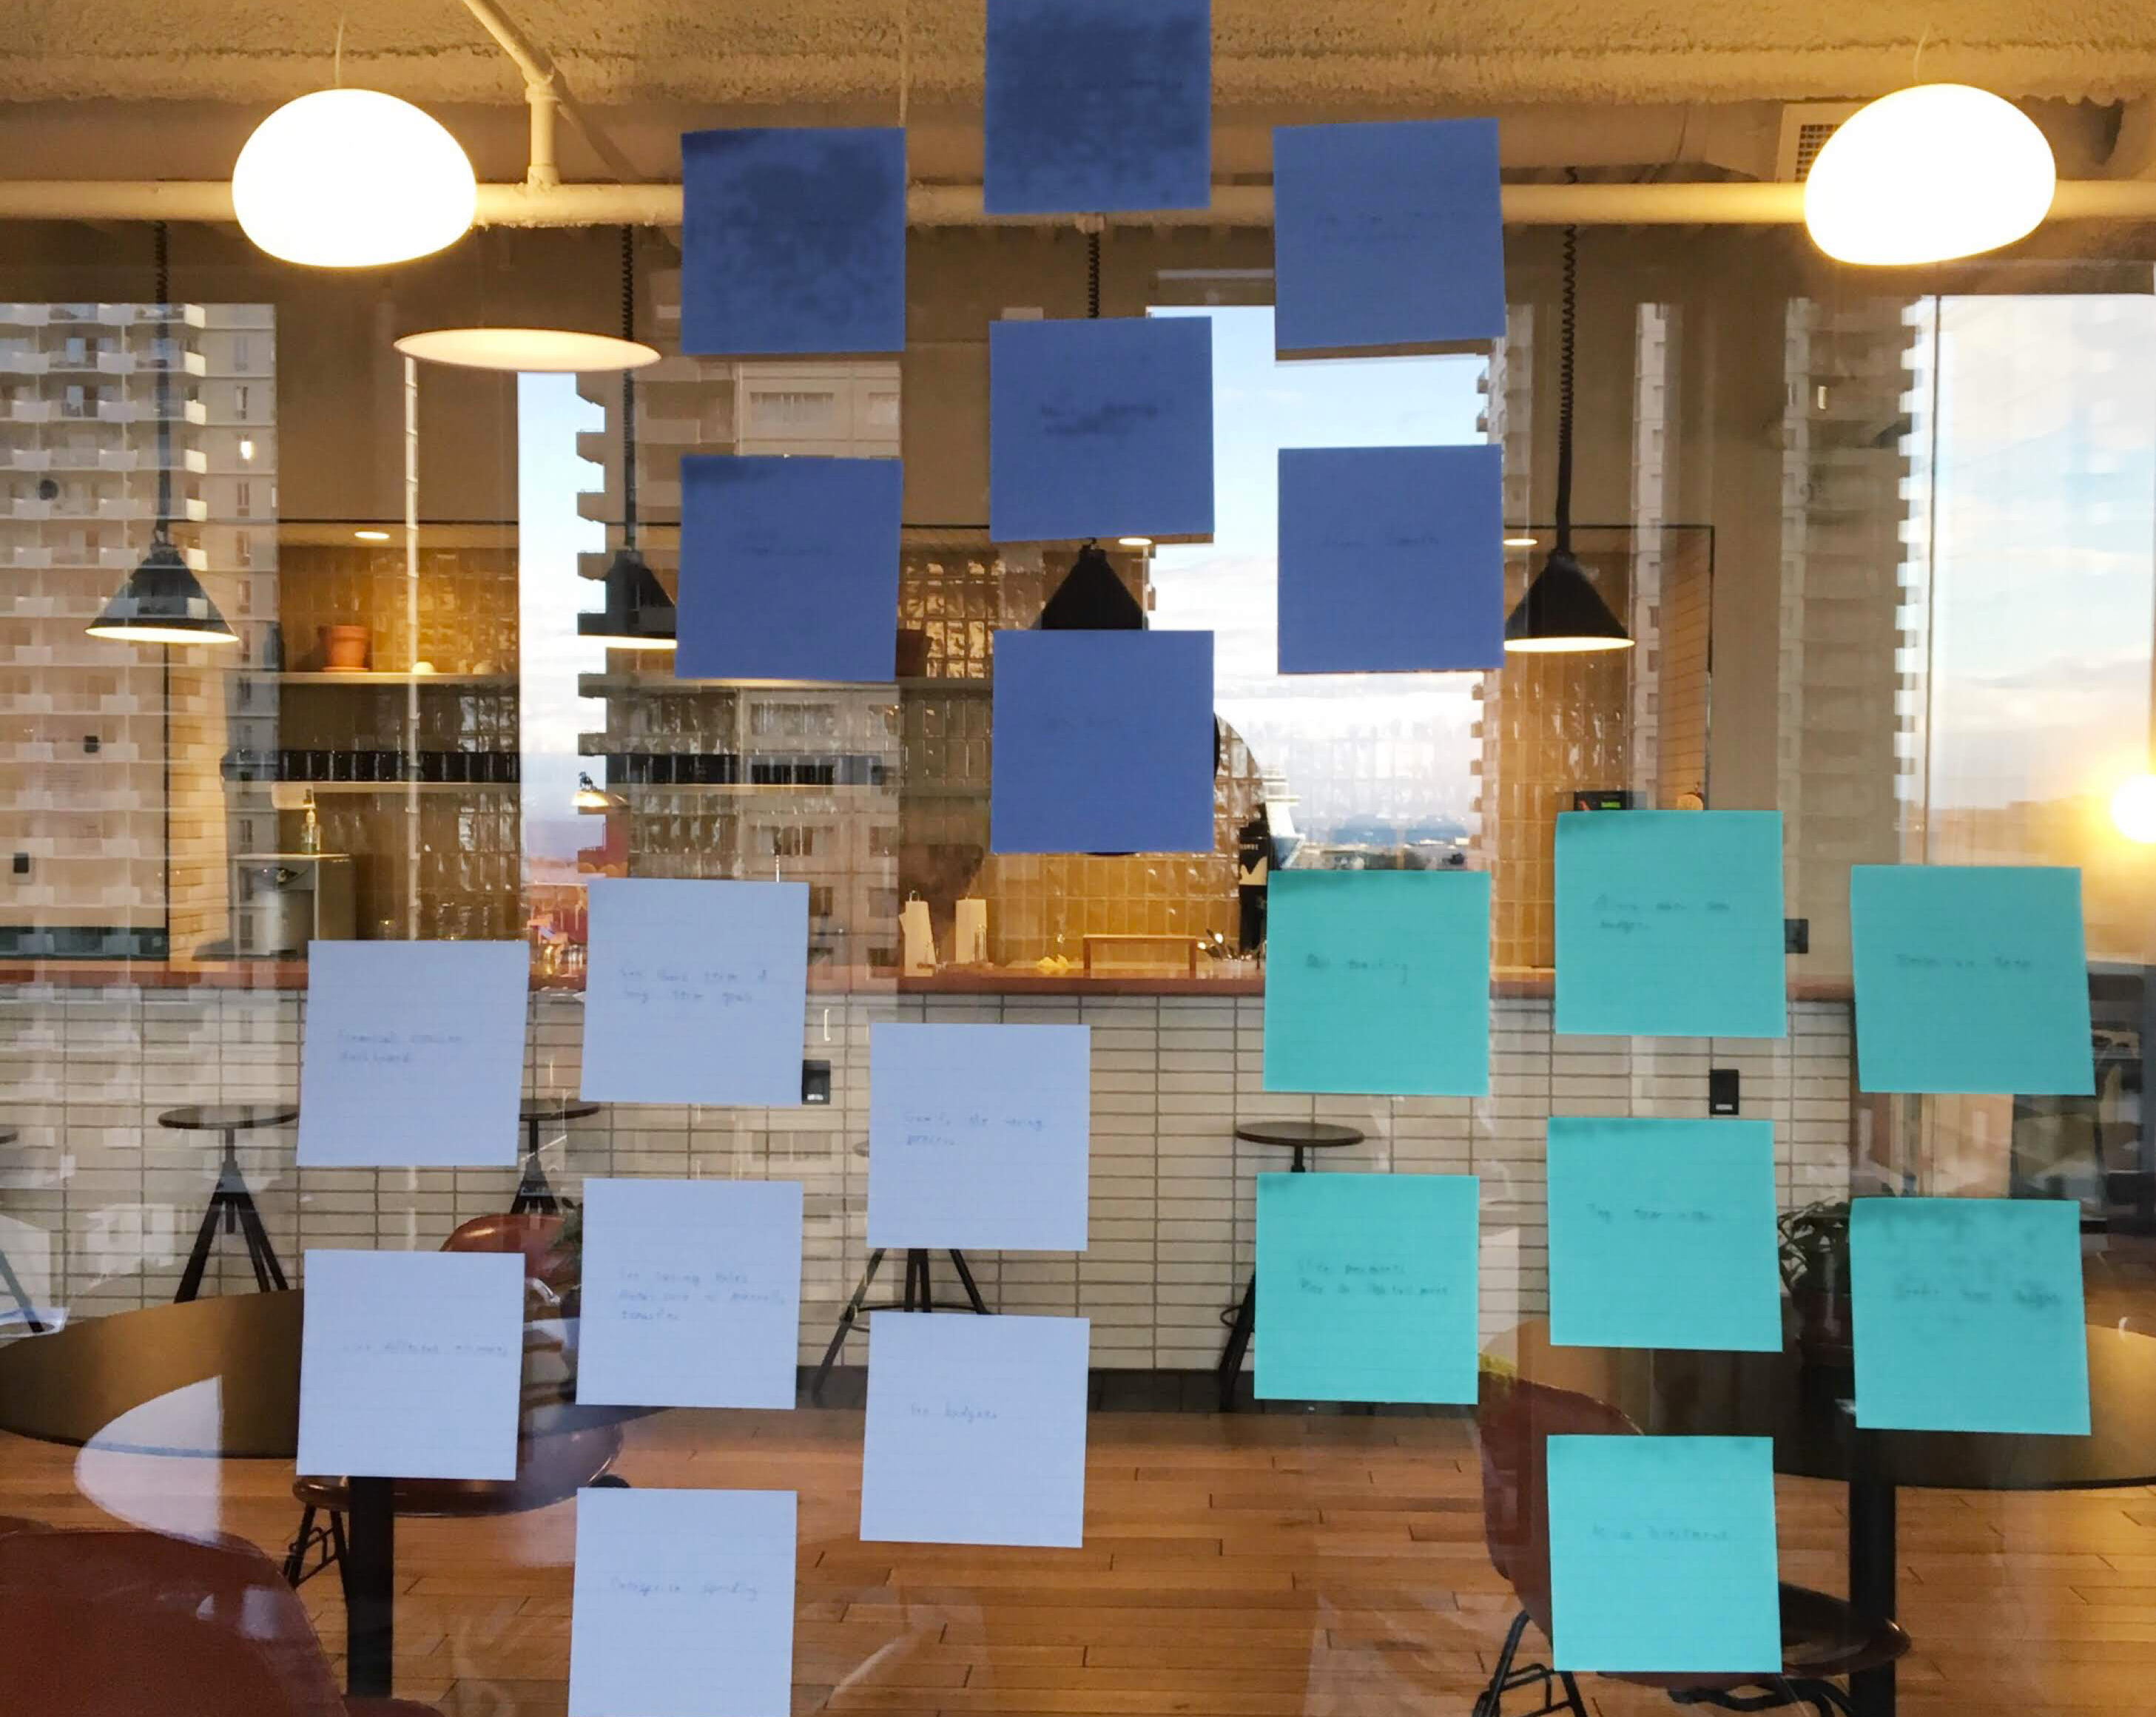
    I shared prototypes with the HR team, observed them interacting with the dashboard, and listened to their likes and dislikes. I then created an affinity map to discover and synthesize insights. From there, I translated that content into insights and finally made a list of prioritized recommendations for the next iteration, outlining actionable next steps.
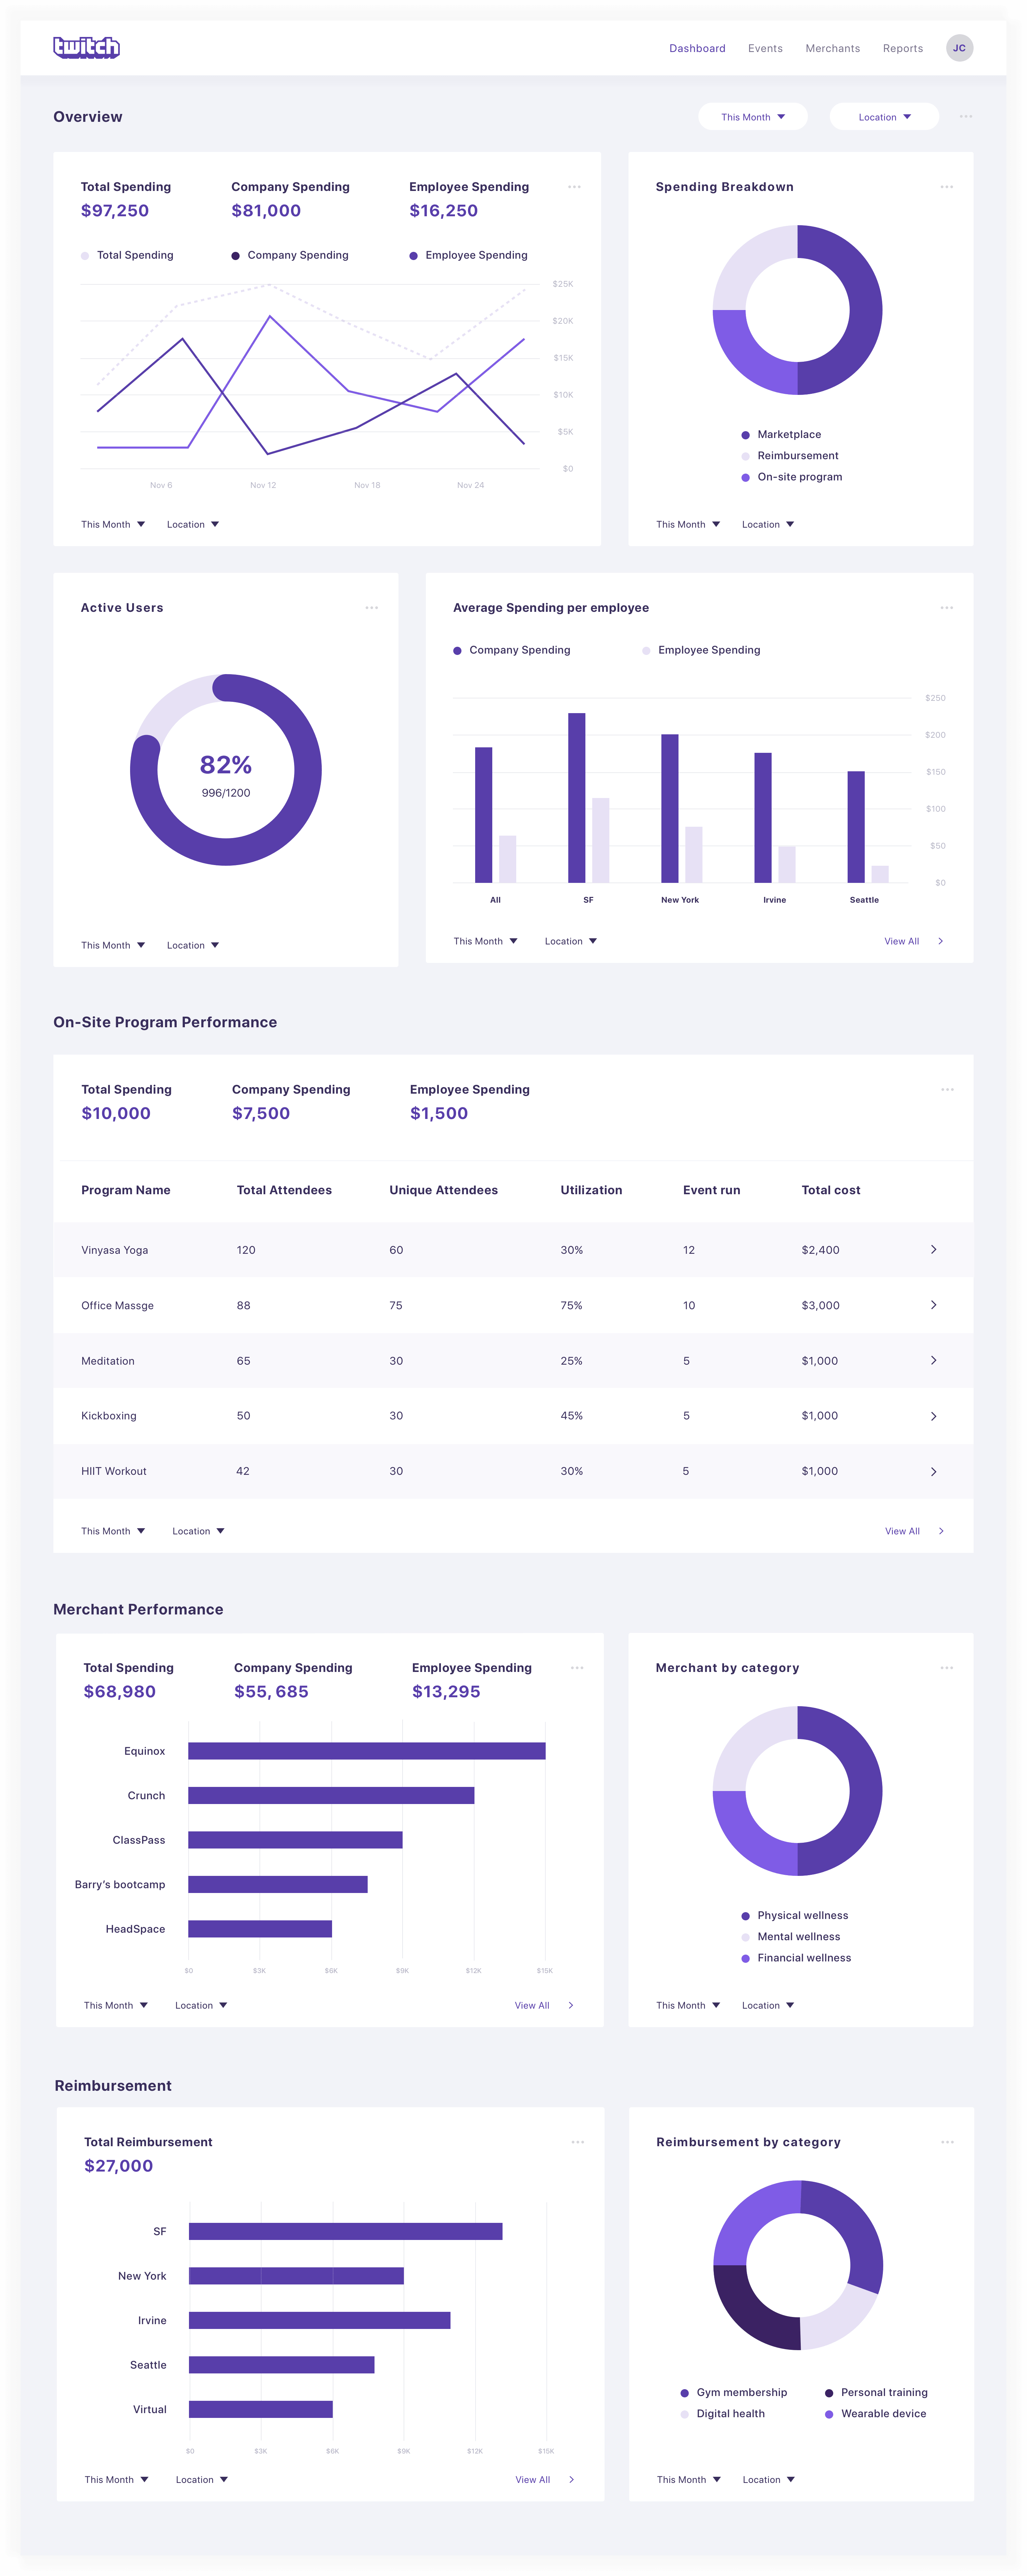
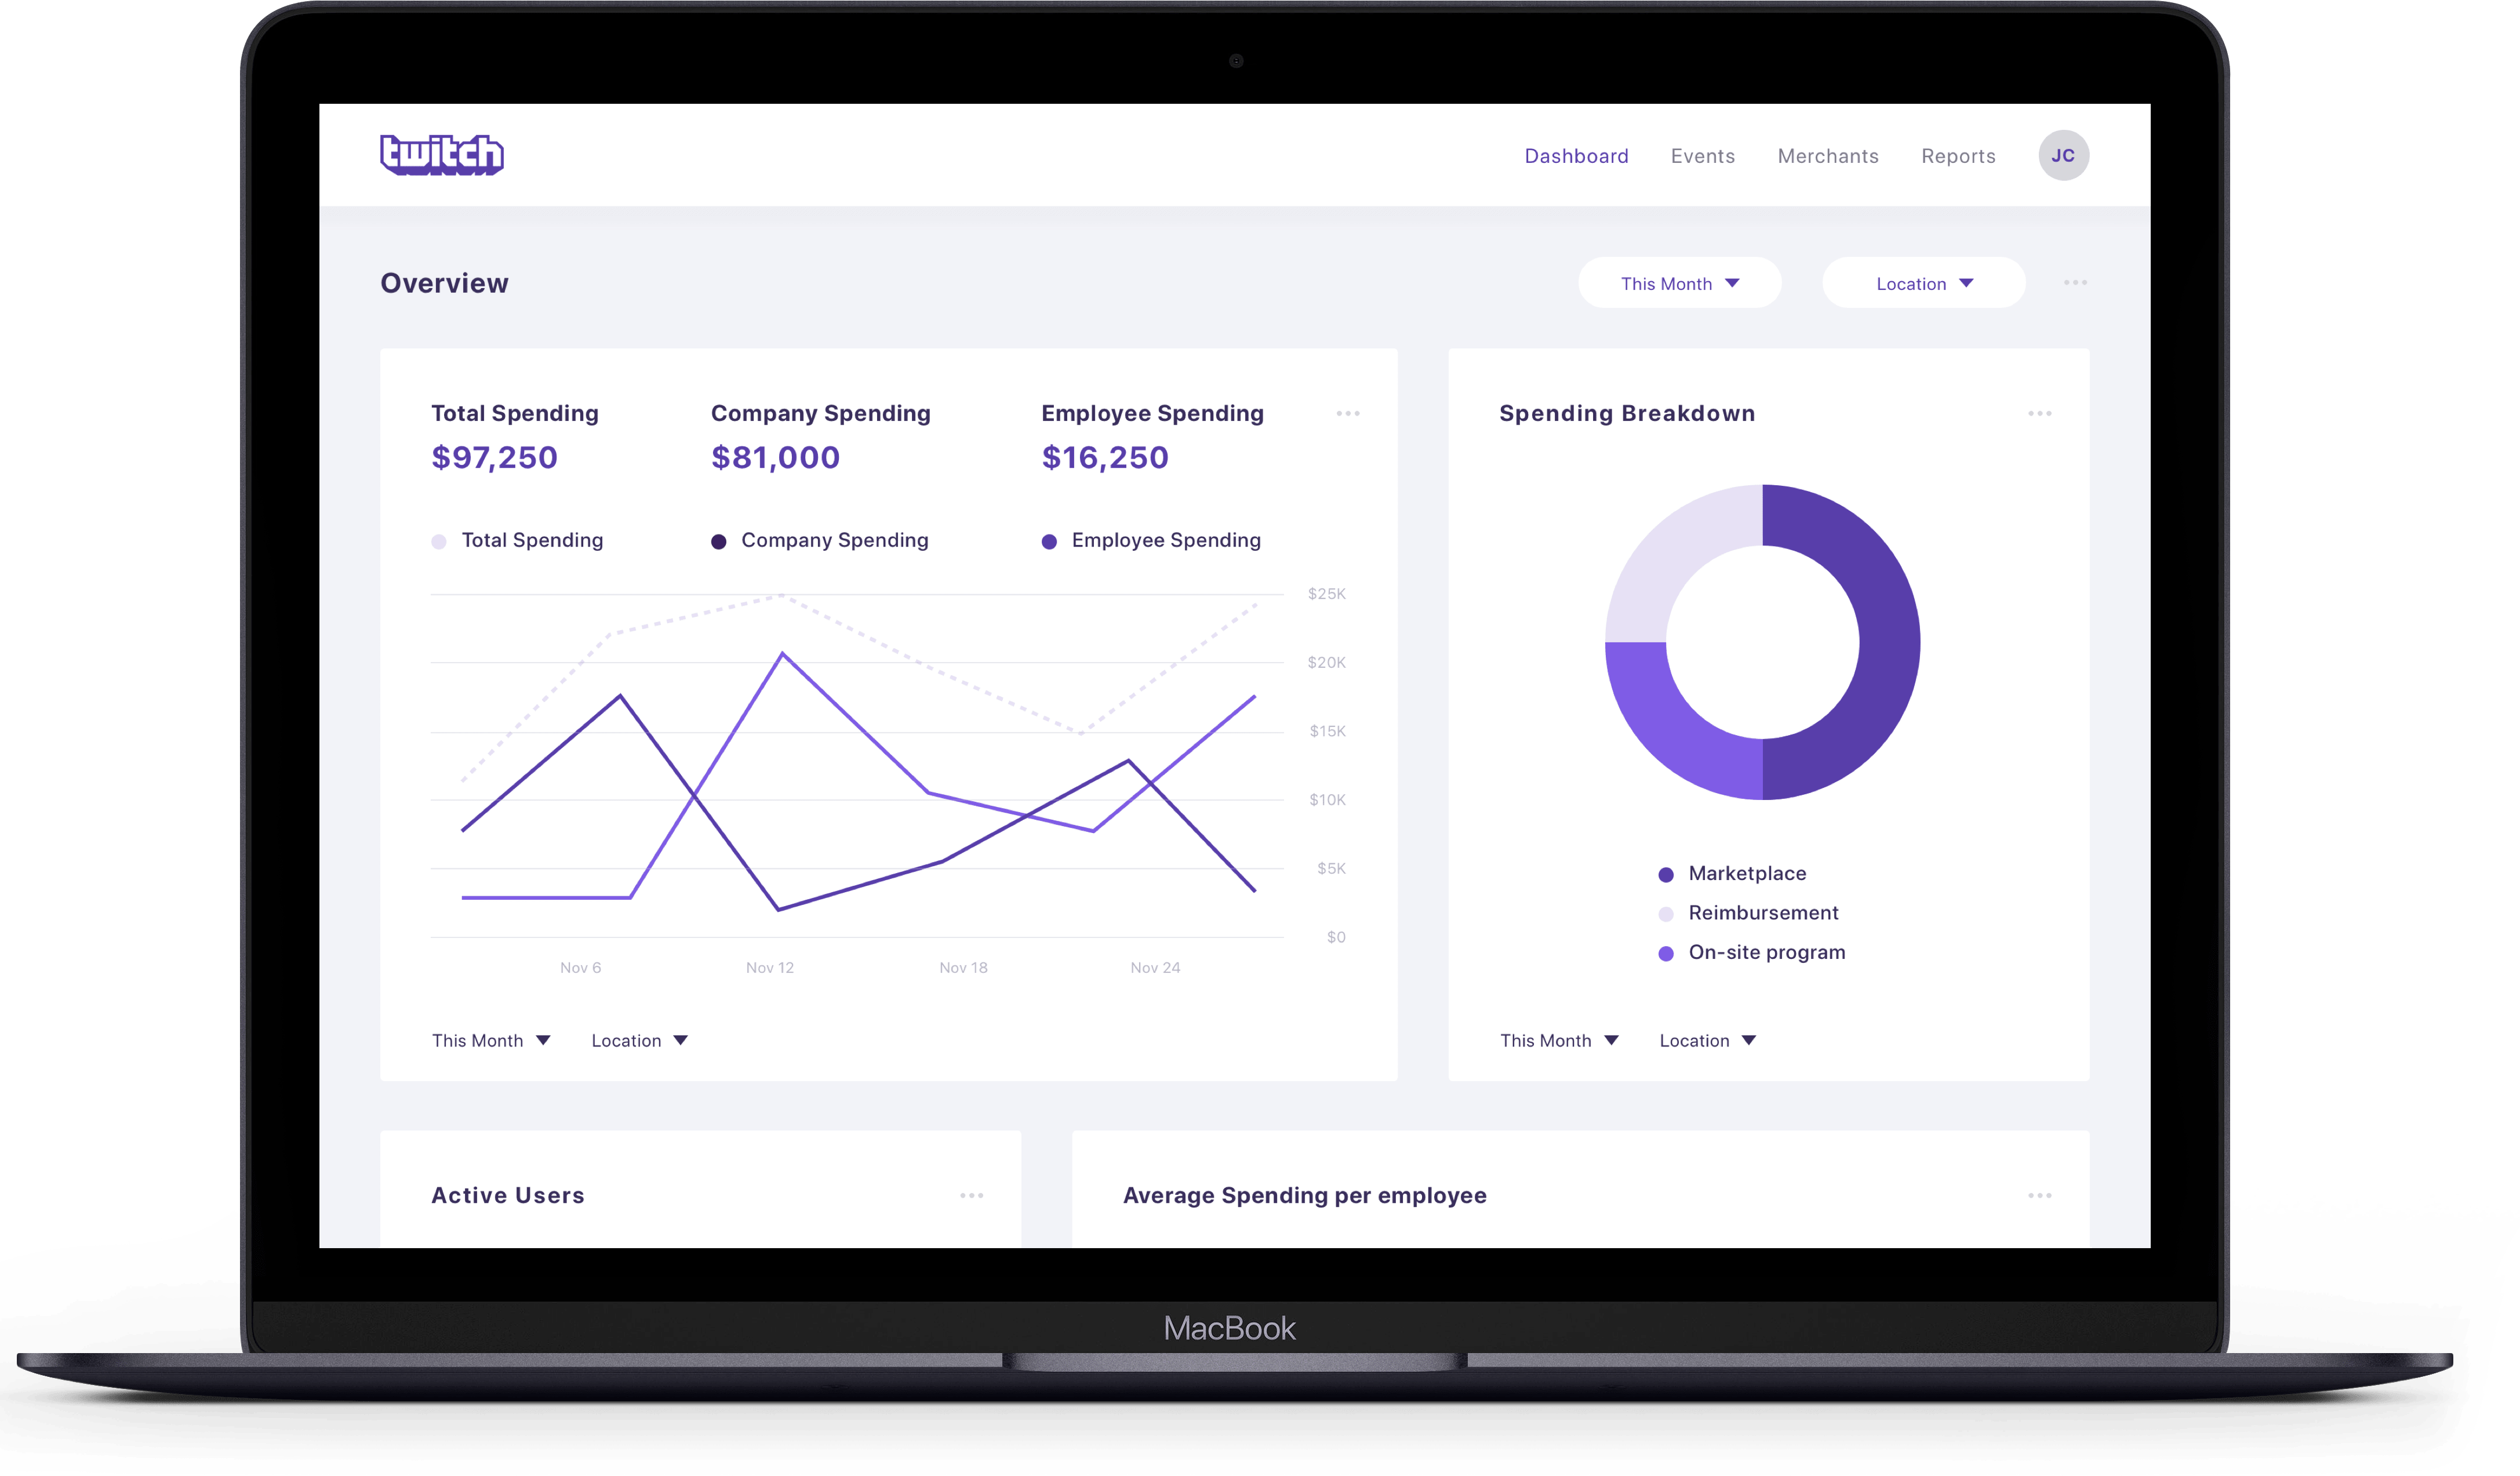
    Final design

    Results


    Since using the dashboard as the central source for exploring program data, the HR team was able to save 100% of the time spent on tracking and focus on improving employee experience based on insights gained from the dashboard. As a result, its employee engagement with the Twitch Life Program increased by 30%.

    "

    The dashboard is our central source of data for learning about our program and prioritizing initiatives.

    "